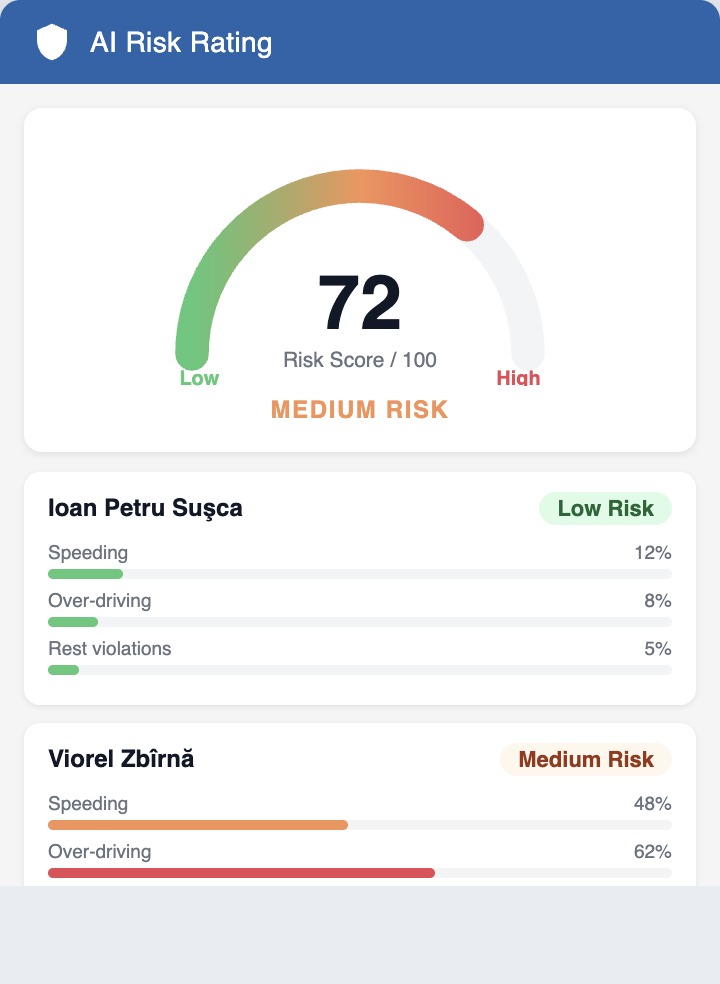
Identifying which drivers in your fleet are most likely to cause incidents — before they happen — used to require a dedicated safety manager spending hours reviewing data. TachoCard's AI risk scoring changes that equation completely.
The Problem with Manual Review
Traditional tachograph analysis tells you what happened after the fact. A driver's risk profile emerges slowly through accumulated violations. By the time a pattern is obvious to a human reviewer, it may already be too late.
Moreover, different violations carry different levels of risk. A single rest period violation is very different from a systematic pattern of daily overspeed combined with shortened rest periods. Human assessment of composite risk is inherently inconsistent.
How the TachoCard Risk Score Works
Every driver's data is processed through a machine-learning model that evaluates 5 weighted risk factors, each contributing a percentage to the final score:
1. Speed Violations (30%)
Not just how many — but how severe and how frequent. A driver with three serious speed violations in one month is rated much higher than one with a single minor overspeed from months ago.
2. Daily Rest Compliance (25%)
Rest period violations are among the strongest predictors of fatigue-related incidents. The model looks at both frequency and the magnitude of each shortfall.
3. Driving Time Accumulation (20%)
Systematic driving beyond daily or weekly limits suggests either operational pressure or deliberate circumvention of rules — both meaningful risk signals.
4. Break Adherence (15%)
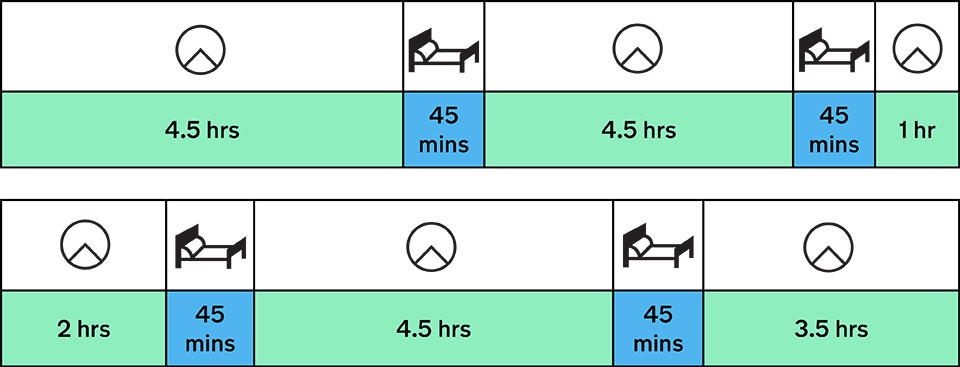
Driving more than 4.5 hours without the required 45-minute break is directly linked to increased accident rates. The model weights the recency of such violations.
5. Infringement Rate Over Time (10%)
Trend analysis: is this driver improving, staying stable, or deteriorating? A rising trend multiplies the final score.
Interpreting the Score
| Score | Meaning |
|---|---|
| 1–3 | Low risk — normal, compliant driving |
| 4–6 | Moderate risk — review recent violations |
| 7–8 | High risk — immediate attention recommended |
| 9–10 | Critical — consider suspension and retraining |
Fleet-Level Insights
For company accounts, TachoCard aggregates individual scores into a fleet risk dashboard, showing:
- Distribution of risk levels across all drivers
- Risk trend over time (improving/worsening)
- Top 5 highest-risk drivers requiring immediate attention
- Comparison benchmarks against similar fleet profiles
Why This Matters
Research by EU road safety agencies consistently shows that high-risk driving behaviour, as measured through tachograph data, is significantly correlated with accident involvement. Early intervention — retraining, scheduling adjustments, or in serious cases, disciplinary action — demonstrably reduces accident rates.
TachoCard puts this predictive intelligence in the hands of every fleet manager, not just those with dedicated safety departments.
Want to see your fleet's AI risk scores? Start your free trial.